Apartment Market Pulse Winter 2023
U.S. Apartment Market
Apartment fundamentals weakened throughout the fourth quarter with economic uncertainty prevailing, leaving many businesses and consumers largely in a holding pattern. RealPage reported negative net absorption for the first time since the Great Recession. Renewal rates remained historically high but were down from the peak hit in 2021. New units came online at a healthy clip and have now significantly outpaced demand for the past two quarters.
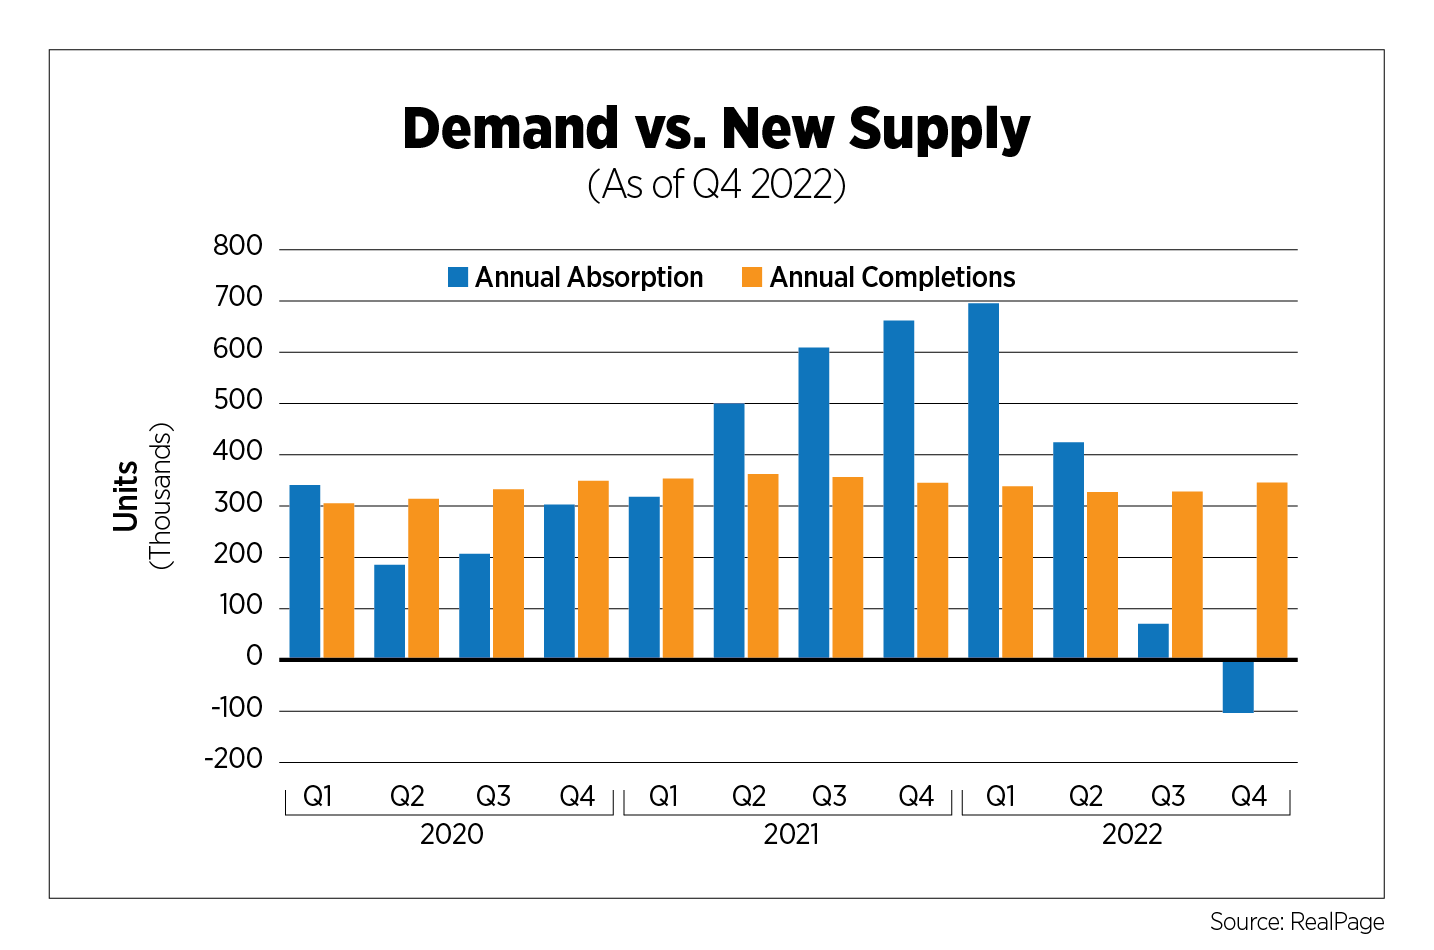
Occupancy rates declined for three consecutive quarters and are down 230 basis points from the same time last year. While year-over-year rent growth remained healthy at 8.9%, rents declined over the quarter by 0.6%. Rent growth forecasts for 2023 were downgraded by about half a percent at the beginning of the year by CoStar, RealPage and Yardi. And although growth expectations remain moderate, ranging from 2.6% to 3.1%, it is significantly off from the heady gains of 2021. Yardi subsequently dropped its forecast again by another half percent, from 3.1% to 2.6%.
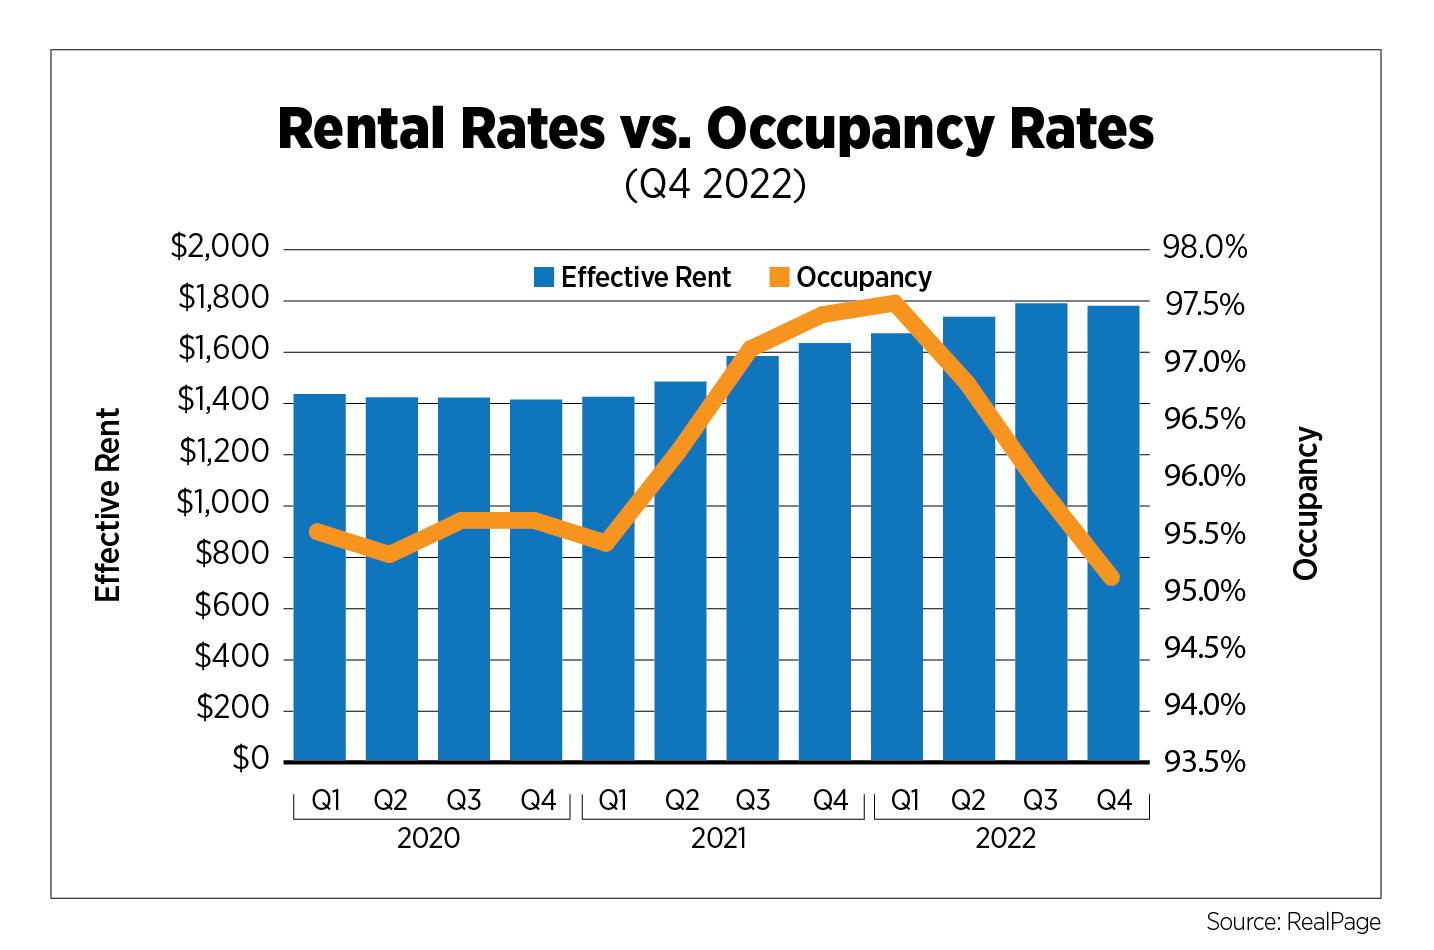
Metro-level data varied widely. Markets in the Moody’s Analytics REIS dataset experiencing the greatest declines in occupancy during the quarter were secondary and tertiary markets: Chattanooga, Tenn,; Greensboro/Winston-Salem, N.C.; Greenville, S.C.; New Haven, Conn.; and Jacksonville, Fla. While all those markets saw abundant new supply delivered throughout 2022, both New Haven and Jacksonville witnessed decades-high levels of completions, according to CoStar. Markets experiencing an increase in occupancy were a mixed bag in terms of size and region, but each benefited from healthy labor markets: Albuquerque, N.M.; Washington, D.C., and its Maryland suburbs; Charleston, S.C.; and Columbia, S.C. All but Albuquerque ended the year with unemployment rates below 3%, but Albuquerque ranked fifth in the country for the greatest decline in the unemployment rate, down 170 basis points to 3.1%, still below the national average.
Memphis, Tenn., was the only market in Moody’s 79 tracked metro areas to experience a year-over-year decline in effective rents, but rents in 12 markets fell from the prior quarter. Baltimore, Memphis and San Bernardino/Riverside, Calif., dropped by 3.4%, 3.3% and 2.0%, respectively. Buffalo, N.Y., Minneapolis and Knoxville, Tenn., were top markets for rent growth, averaging 4.4% to 5.1%.
Construction permits in Q4 were at their lowest levels since Q2 2021, while starts and completions remained elevated, according to data from the Census Bureau. While 2022 marked 30+ year-highs for permits and starts, completions were in line with levels seen over the past five years. Markets with the greatest amount of construction, reported by Yardi as a percentage of existing stock, were Austin, Texas, Minneapolis, Seattle and Nashville, Tenn.
Several private sector data providers are predicting levels of completions this year not seen since the 1980s, with some forecasting upward of 600,000 units coming online this year. The gap between permits authorized and not started was at a record high in January, meaning we can expect a substantial number of deliveries to get pushed into 2024. In this high interest rate and high inflationary environment, some developers are taking a wait-and-see approach as costs for capital, construction, materials and labor all remain elevated.
U.S. Capital Markets
The apartment sector drove the decline in commercial real estate transaction volume in Q4 2022, down 68% from the prior year, the most of any property type, according to Real Capital Analytics. With costs to borrow the highest in more than a decade and sellers reluctant to lower their prices, deal activity cratered toward the end of the year, totaling $51.7 billion, the lowest level since Q1 2021, just before activity hit record-breaking levels in subsequent quarters. Average prices per unit can be volatile from quarter to quarter but have been trending downward for the past two quarters and may well have peaked during Q2 2022. Cap rates generally edged downward this year but are also likely at a turning point.
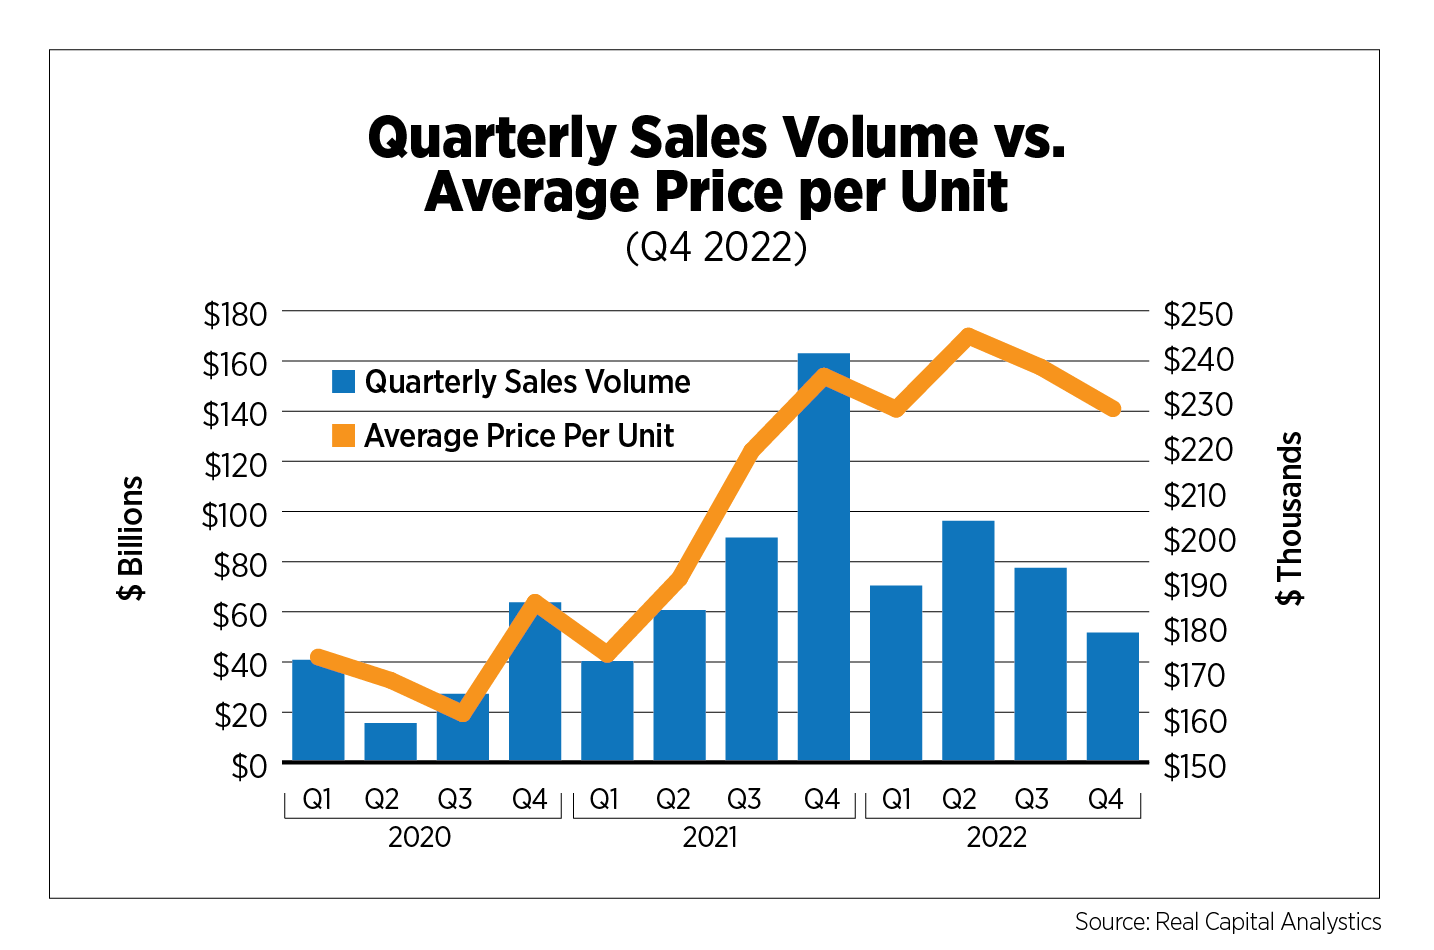
RCA’s CPPI (Commercial Property Price Index) for apartments, based on repeat sales transactions, removes the impacts of asset quality and location on transactional pricing data, resulting in a purer measure of price changes. On an annual basis, the CPPI for apartments increased 1.8% driven by increases in garden properties (4.0%) and properties in non-major metro areas (5.4%). High-rise properties and the six largest metro areas showed declines of -3.0% and -2.4%, respectively.
U.S. Build-to-Rent Market
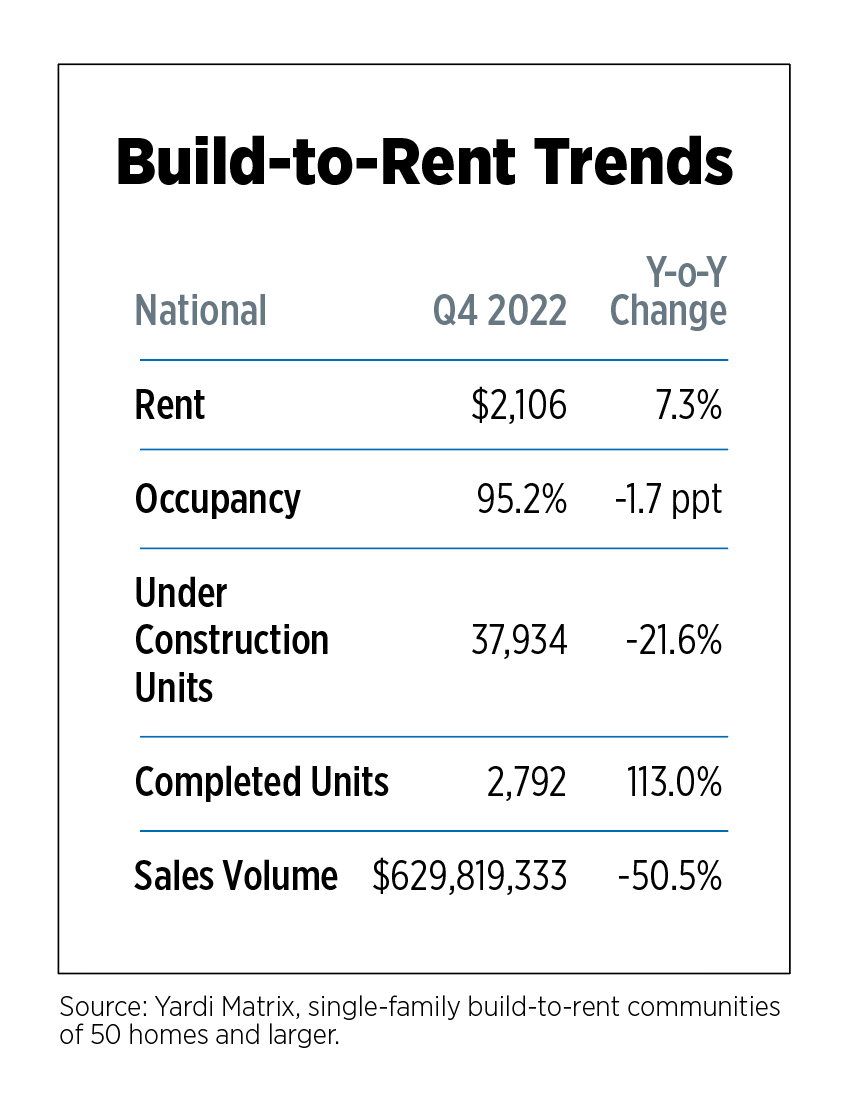
Single-family rent growth as reported by Yardi remained essentially flat in Q4, increasing just 0.2% following average quarterly increases of 3.0% beginning in 2021. Occupancy rates have declined for five consecutive quarters, and at 95.2%, are at the lowest level since before the pandemic. Just under 2,800 units were completed, bringing the total for the year to more than 10,000, a high for the dataset which began in 2011. Units under construction have been trending down for the year. Nearly 38,000 units were under construction during the quarter, down from a peak of 48,400 in Q4 2021.
Fourth quarter sales volume was the highest of the year, but well off Q4 2021 levels. Annual volumes totaled $2.3 billion, down from last year’s breakneck pace of $2.7 billion. Sales can be expected to moderate further as interest rates remain high.
Only a handful of markets saw year-over-year rent declines: Atlanta, San Francisco, and Nashville with Houston and Detroit also showing signs of softening. Sacramento, Calif., Washington, Indianapolis and Tampa, Fla., were top markets for rent growth.
U.S. Economy
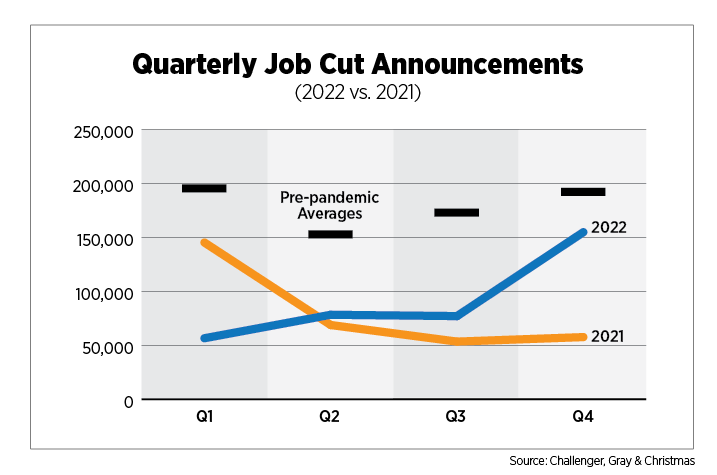
The job market continued to amaze, posting a 517,000 payroll increase in January. Job openings were near record levels and initial claims for unemployment were consistent with periods of solid economic growth. One employment indicator that softened was layoff announcements, which outpaced 2021 levels starting in Q2. More than 150,000 cuts were announced in Q4, but that figure remained well below long-term averages. Not surprising, the technology sector was far and away the hardest-hit sector, with total job cut announcements for the year more than three times the automotive sector, which came in second place. It is important to note that these are layoff announcements, not actual layoffs, so they could take place immediately, or some months later, or even to a lesser degree if an employer experienced meaningful attrition. Additionally, these cuts will not appear in the monthly jobs report while laid-off employees are being paid severance. Job cut announcements continued into 2023, with over 100,000 cuts in January alone, the worst January since 2009 during the height of the Great Recession.
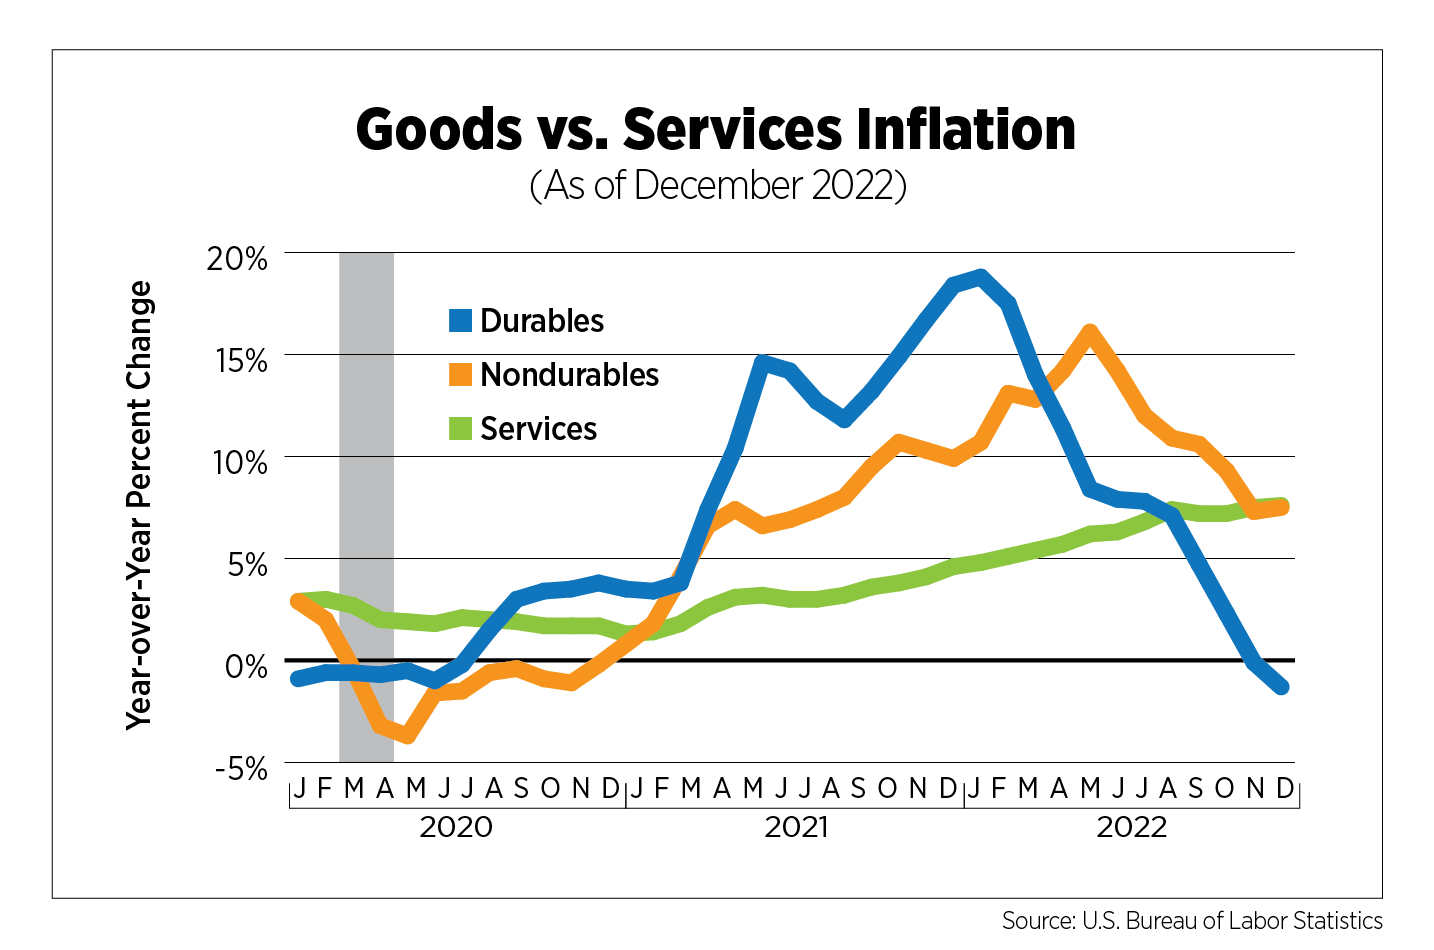
Despite an otherwise healthy job market and robust consumer spending, uncertainty and recession fears remained rooted in both consumer and business sentiment, fueled by high interest rates and inflation. While inflation has begun to ease, especially for goods, services inflation (including housing, transportation, medical, education and recreation, among others) is proving stickier and showing little signs of improving.
Signs of life returned to the for-sale housing market in January by way of increased mortgage applications, but they were short-lived. Existing home sales started 2023 on its 12th straight month of decline and the Case-Shiller Home Price Index dropped 10% since peaking in June. With mortgage rates back on the rise and inventories slipping once again, housing market struggles are far from over.
Outlook
Some economists and analysts have turned more optimistic over the past several months, suggesting the U.S. may be able to avoid a recession. Still, prospects for growth remain anemic at best, and negative at worst. Prior precursors of recessions, such as the inversion of the yield curve and other predictive indicators continue to raise red flags, and many experts remain firmly in the recession camp.
The most recent Outlook Survey from the National Association for Business Economics, released in February, showed the majority of respondents believed the probability of recession within the next 12 months is 50% or more, although timing has been pushed from Q1 to Q2 or later. In separate reports released in early March, Oxford Economics advanced its recession timing to Q3 while a model published by The Conference Board, a national think tank, put the probability of recession at 99% and still expects it to start in early 2023.
Regardless of whether a recession takes hold in 2023, operating, investing and developing in a high inflation and high interest rate environment will continue to pose challenges for the apartment industry. And while rents are declining in some market segments according to private sector data, the CPI for rent, which is well-documented as a laggard of market conditions, continues to rise as do other household costs. Wage growth is healthy, but still not meeting inflation. These persistent pressures on affordability fuel policy proposals like rent caps and other forms of rent control across the country, only adding to industry challenges in 2023.
